Wildlife Trading Company
Industry
Retail
Solution
Power BI
Customer Size
Executive Summary
With dozens of locations across the United States, Wildlife Trading Company is a leading retail operations partner for some of the most prestigious zoos, aquariums, museums, botanic gardens, and more. Continually growing, Wildlife Trading Company initially turned to MIBAR for a NetSuite implementation, but to blend pre-implementation historical data in Excel with current data in NetSuite, they needed another level of visibility. They again turned to MIBAR, this time for a Power BI implementation.
Siloed Data, Days to Report: Life before Power BI
When MIBAR implemented NetSuite for Wildlife Trading Company in 2017, the company was able to leverage the solution for increased visibility into the current operations. However, managers needed a new way to blend current data in NetSuite with historical data in Excel. With only one year of historical data in NetSuite, earlier data was siloed between Excel and NetSuite, the company needed a better way to compare earlier data to see a clearer picture of their operations.
Management at both the headquarters and each location wanted to be able to dig deeper into historical data from 2016 and 2017 to see where the business stood, leaving Wildlife Trading Company with a few choices: Pay for thousands of hours of development to model data, continue to spend days downloading data from NetSuite and manually enter it into Excel, or implement a modern BI solution that can model and merge both Excel and NetSuite data in real time for better understanding of the numbers.
Wildlife Trading Company discussed their options with the MIBAR team, discovering that Microsoft Power BI had the capabilities to offer a seamless transition from pre-NetSuite sales data to current sales data in NetSuite, offering powerful modeling capabilities without thousands of hours of development.
Power BI offers a Seamless Transition from Pre-NetSuite Sales Data to Current Data
In 2018, MIBAR built an intuitive and user-friendly reporting environment in Power BI to provide in-depth insight into sales data. Prior to implementing Power BI, Wildlife Trading Company used a combination of Excel Spreadsheets and NetSuite Reports. While NetSuite Reports did much of what was needed, Wildlife Trading Company wanted a more interactive experience leveraging additional information to create a centralized platform for reporting against historical data.
MIBAR implemented Power BI for Wildlife Trading Company, combining live NetSuite and historical Excel data using a common data model. By merging both NetSuite and Excel data into a single data set, we customized Power BI to deliver three main reports to track sales data, sales data as it relates to attendance, and key inventory metrics.
The Flexibility to Understand and Compare Sales
One of the first needs Wildlife Trading Company had was to compare sales and budget data across each of the company’s three sales channels—merchandise, facepaint, and photos—allowing users to analyze trends by region and location.
With Power BI and a customized flash sales report, Wildlife Trading Company can gain additional insight into the information, analyzing month to date and year to date sales data, able to compare information for whatever date they choose. With summary information and expanded information, they gained a dynamic experience—answer a quick question with summary data, or simply click a button to dive into the underlying drivers of those numbers.
A Better Way to Slice and Dice Information
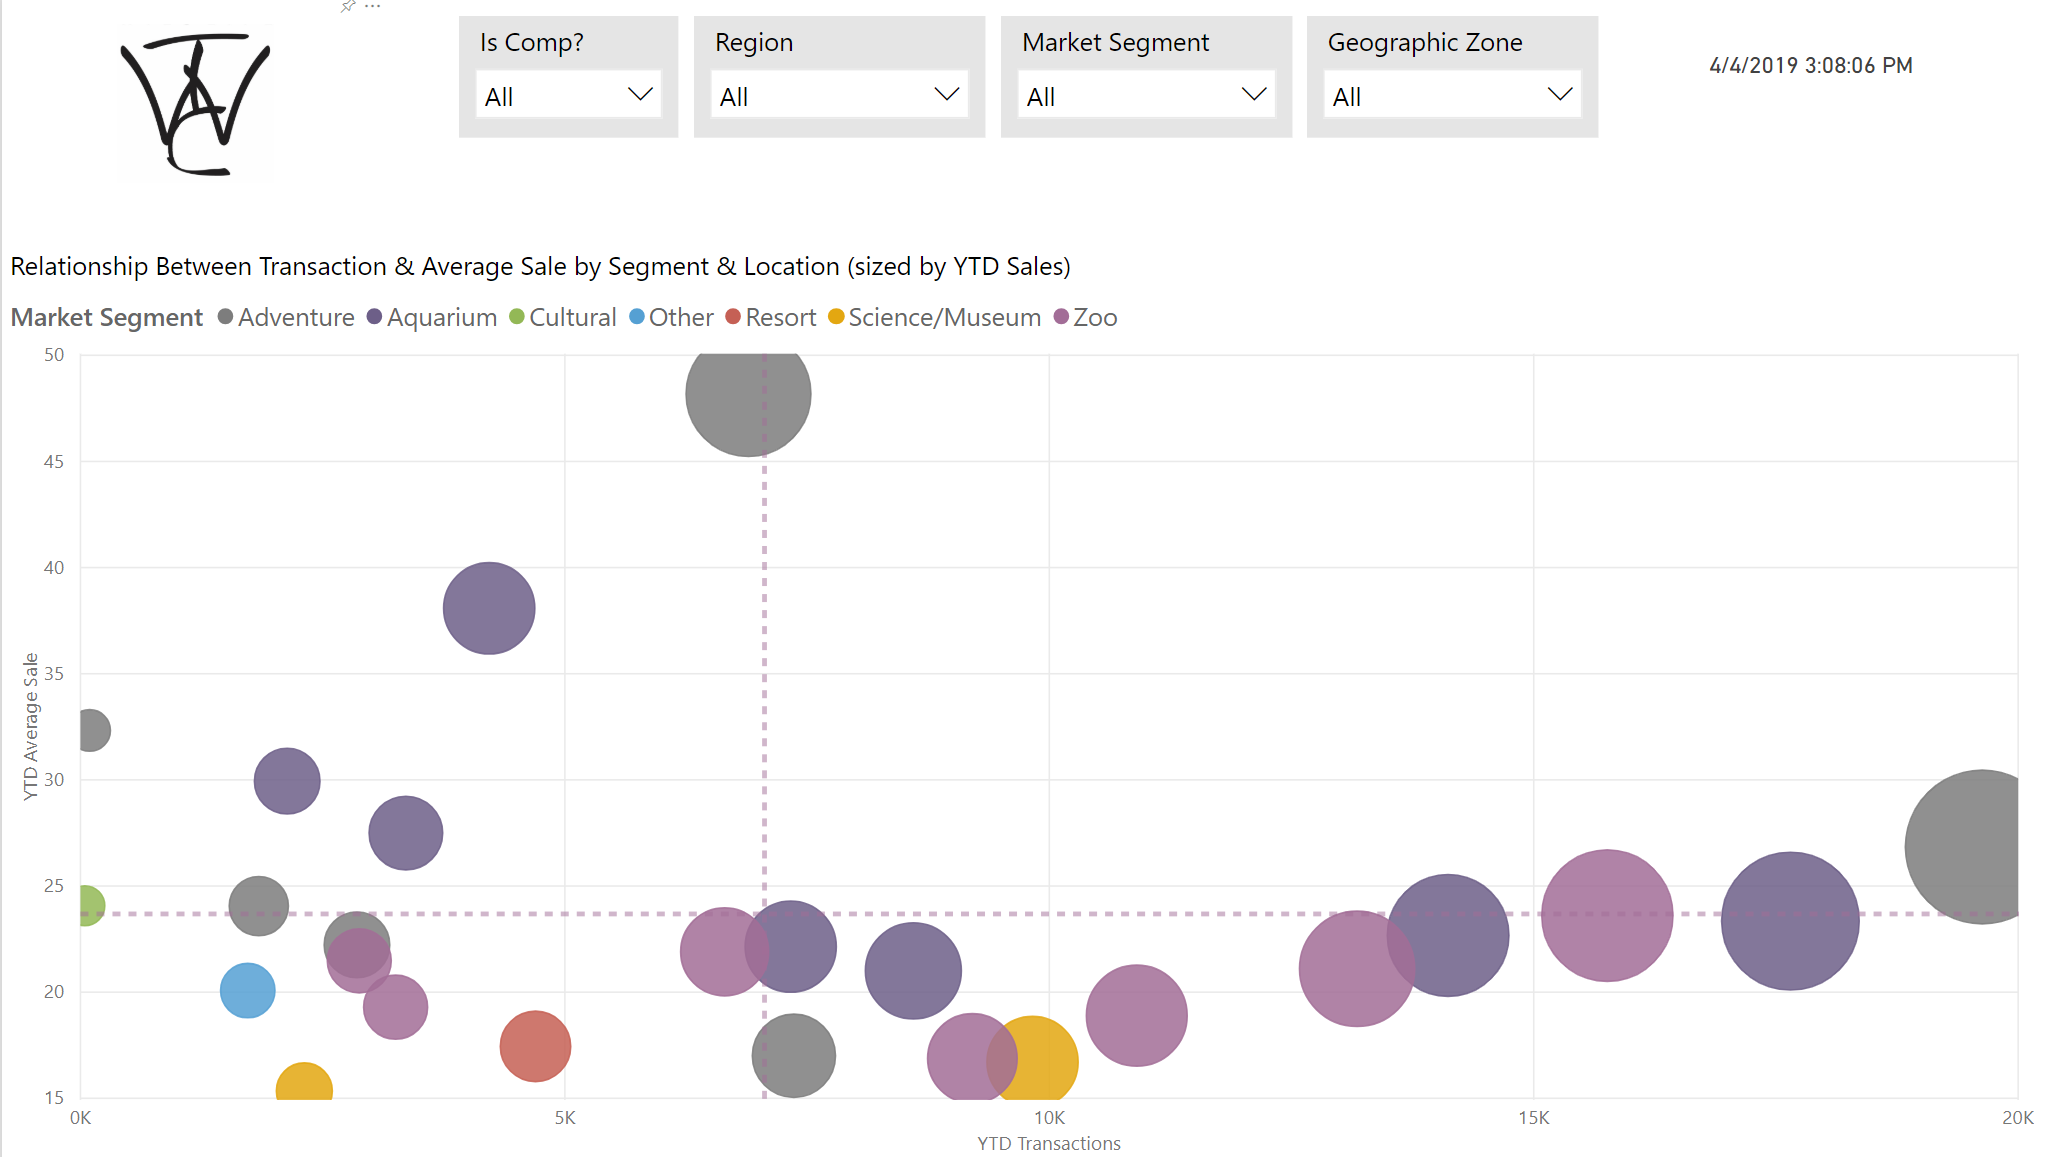
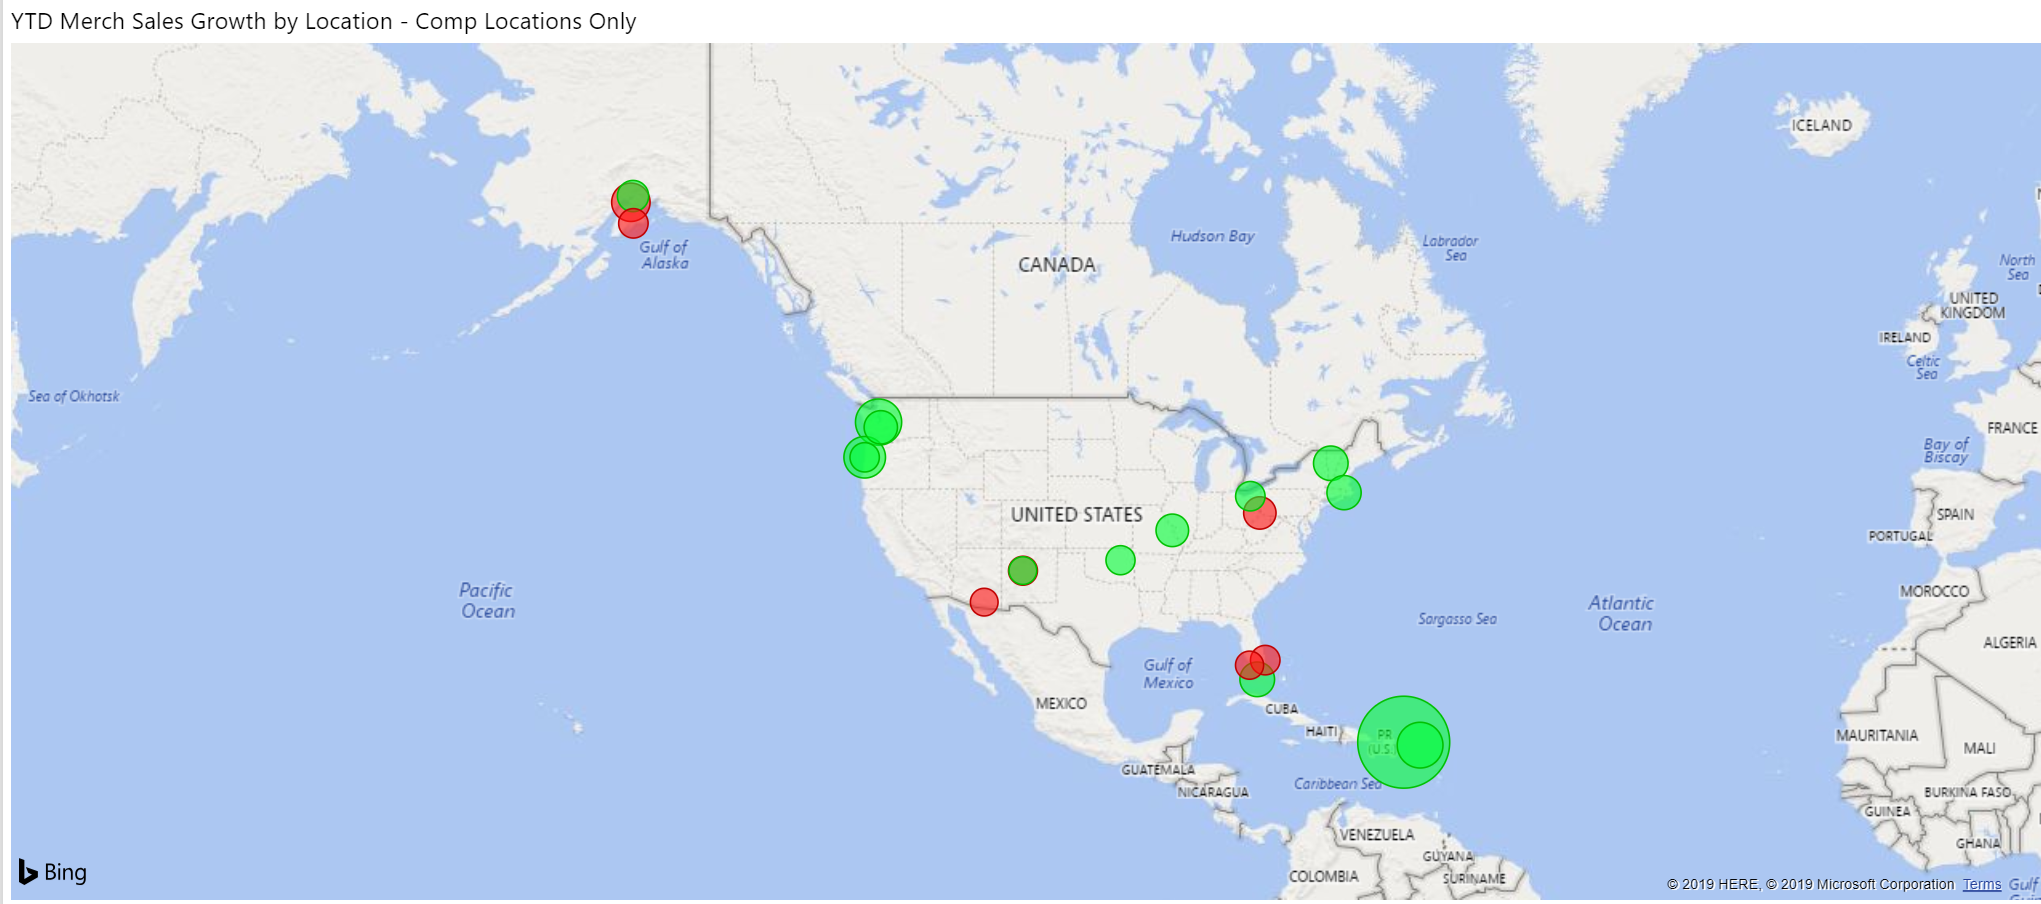
While Wildlife Trading Company started with zoos, they have since expanded their market to open gift shops across multiple destinations including aquariums, cultural attractions, and other activities. Not only did this affect the mix of products, the company needed to understand how attendance and sales data worked together with geographic location and in turn seasonality.
MIBAR was able to develop a report in Power BI that gave Wildlife Trading Company the ability to look at different market segments, geographic locations, regions, and more. For example, the company would be able to dive into attendance and budget data for aquariums in the Northwest, zoos in Florida, or the like, gaining insight into the attendance and how it relates to the sales data.
The reporting functionality goes even further, allowing Wildlife Trading Center to analyze inventory in terms of cost and projected revenue to compare current and potential sales at any moment in time, digging even deeper to understand which product line sells best in each location.
Plan Inventory with More Accuracy
With thousands of SKUs spread across dozens of locations, Wildlife Trading Company needed a way to understand the way each item is grouped. Using the Vendor Item Analysis report, the company is able to track margins, inventory quantity, and margins for each item category at each location, breaking it down even further to understand which vendors are selling well.
This was one of the most needed features for Wildlife Trading Company and one of the greatest challenges of their former solution. Power BI delivered, able to use general ledger reports to compare inventory level over time to cost over time, taking this even further by accounting sales price to gain a clearer picture of revenue, profits, and initiatives.
Power BI Delivers a Seamless Experience
By breaking down silos, Power BI now delivers a seamless experience, combining two different data sources in a way that the end user only sees usable information. Prior to implementing Power BI, it took days for people to aggregate data between the two solutions, generating reports with nowhere near the depth or scope of the current solution. Through this implementation, Wildlife Trading Company was able to report against prior periods, use this solution to save time in reporting, and operate with more visibility than ever before.
Today, end users have the tools they need to get at a glance understanding of trends, make decisions in real time, plan and budget for the future, and understand what’s driving all of this.
“I would classify the past few days as enlightening and invigorating. Your team is a welcome breath of fresh air in an otherwise murky NetSuite world! Very helpful & pragmatic – exactly what we needed! A straight shooter with practical solutions for our business model. I’d definitely like MIBAR to help us going forward in several areas – set up of Suite Analytics Connect & Power BI – just to name a few.”
